

Is the Music Sector Getting Better Statistics?
By Hans Hoegh-Guldberg. Published in Music Forum magazine, Vol 18 Issue 4 (August 2012)
Hans is a Cultural Economist and Editor of the MCA Music in Australia Knowledge Base: www.musicinaustralia.org.au
Is the Music Sector Getting Better Statistics? The short answer is: Not nearly fast enough
Back in 2005, Dick Letts and I wrote a report for the Cultural Ministers’ Council setting out a plan for improving the statistical framework for the music sector. The response was friendly but competing priorities minimise the resources that the Australian Bureau of Statistics (ABS) can devote. Most recent improvements in the music database have come from non-ABS sources – the Australia Council, APRA|AMCOS, Live Performance Australia, and others.
Within the MCA, the 2005 report became a catalyst for the launch of its Music in Australia Knowledge Base, which was deliberately broadened beyond purely statistical content to include many fine verbal descriptions and discussions of issues. In May 2012, however, we completed a major review of music sector statistics that exist or could be developed. It reveals major gaps but also some new and useful non-ABS sources.
The statistical aim of the knowledge base is ambitious – nothing less than a complete numerical mapping of the contribution of the music sector to the economy, directly and through an enhanced cultural and social life to our nation’s long-term development. To develop the statistics will be a big task that will take much time and will need substantial contributions from outside the limited resources of the MCA itself.
The knowledge base itself has been remodelled along ‘wiki’ lines – same system as the well-known Wikipedia which benefits from contributions from large numbers of people. Wiki makes it more adaptable and expandable, and more amenable to contributions from outside the immediate MCA team. We appeal to readers to help us to meet the objectives of the knowledge base – which include improving the data – in the interest of everyone associated with the Australian music sector.
Many of the statistics in our review of ABS and non-ABS sources need to be expanded – the review is an attempt to map what is available for further examination, encouraging others to contribute to subsequent detailed research. I hope they may help to demonstrate the potential importance of good statistics, including their capacity to produce warning signals.
Following are three examples of the statistical information found on the Music in Australia Knowledge Base.
How many performing musicians are there?
It is evident from Chart 1 that the answer depends on how we define performing musicians (instrumentalists and singers). The five-yearly Census asks for a main occupation defined as a person’s main job last week – usually interpreted to be his or her main job. The 2006 Census counted about 6,900 performers, shown in the first bar of the chart. Though it may be said to represent a core group of instrumental and vocal professionals, the census figure is generally regarded as unrealistically low.

Since 1983, Professor David Throsby has conducted five major surveys of professional artists for the Australia Council. The latest refers to 2009 and uses its own survey estimate that 44.3% of the responding artists worked more than 50% of their time on creative work. Applying this percentage to the 2006 Census figure of 6,900 musical performers would yield a total of some 15,500 persons but some of these would have been counted in the Census. Based on their survey, Throsby and his co-author Anita Zednik estimated that 12,500 performers spent half of their time or more on creative activities in 2009. This is more than 80% above the 2006 Census count of ‘full-time’ professionals.
The Throsby surveys for the Australia Council are and have always been designed to analyse ‘the economic circumstances of professional artistic practice across all major artforms apart from film’ (Throsby and Zednik, p 7). Over the past ten years or so, however, there has been an increased interest in a neglected part of the music sector, known as the venue-based live music industry and performed by what has become known as the casual music workforce. The Music Council actively promotes the interest in this musical activity, concentrated on pubs and clubs and similar informal venues.
A number of reports on the casual music workforce published during 2011 culminated in a study by Ernst & Young commissioned by the Australasian Performing Right Association, APRA. The third bar on Chart 1 shows an estimated 22,700 individuals who would represent a net addition to the number of performers, as they would be largely missed in a count of professional ‘full-time’ musicians along the lines of the Census and the Throsby surveys. The casual music workforce is made up overwhelmingly of part-time musicians – the APRA study shows that the 22,700 persons represented 6,400 full-time-equivalent workers, indicating that the average part-time involvement was about 28% of a full-time year.
The report notes (p 2) that the casual music workforce generated an estimated $1.21 billion of income in 2009-10, of which five-sixths came from increased food and beverage sales and the remainder from ticket sales. These revenues were generated from almost 42 million patrons attending an estimated 328,000 venue-based live music performances at 3,900 live music venues across Australia.
Apart from conducting the five-yearly Census and producing a range of other arts-related data, the ABS has for many years surveyed what it calls involvement in cultural activities. Its culture-leisure survey in 2007 showed that 24,900 persons regarded live performance as part of their main job (fourth bar of Chart 1) out of almost 91,000 who received some payment for their performances during the year (fifth bar). In addition, 159,000 persons received no payment, indicating that over 250,000 persons were involved as live music performers in the survey year.
All these statistics are valid indications of the importance of musical performance in Australia. The core of professional musicians and singers is covered by the Census but is plausibly expanded by the Throsby survey showing that the number of musicians spending more than 50% on artistic activities is significantly higher than the Census results indicate.
The inclusion of the casual music workforce playing in pubs and clubs represents a major addition to the database which has only been recognised in recent years. Finally, the ABS involvement statistics provide another important view of the role of musical performance: the number that regarded artistic activities as part of a main job was approximately twice the number of people identified as professionals in the Throsby survey. It is inadvisable, of course, to drop the concept of a music professional but it needs to be supplemented by the fact that many musicians are not captured by the ‘professional’ tag but are nevertheless important – socially, culturally, and economically.
The relevant statistical evidence is that not only did almost 91,000 persons receive some payment for their performance (though only 22,300 received $5,000 or more), but another 159,000 people performed without payment. The findings underscore the importance of nurturing musical performance and participation more than happens currently.
Big shifts in expenditure on culture
The latest ABS household expenditure survey maps household expenditure on culture in four categories: ‘other culture’, ‘heritage’, ‘other arts’, and ‘music’ (Chart 2). The figures were adjusted for inflation to show constant 2010-11 values. The basic statistics were collected as weekly expenditure, but the survey tables also show what this means in terms of total Australian expenditure as shown in Chart 2. Expenditure on culture increased from just under $18 billion in 2003-04 to $20.3 billion in 2009-10 (+12.8%). About half was due to growth in the total number of households and half to increased expenditure per household (+6.6%).
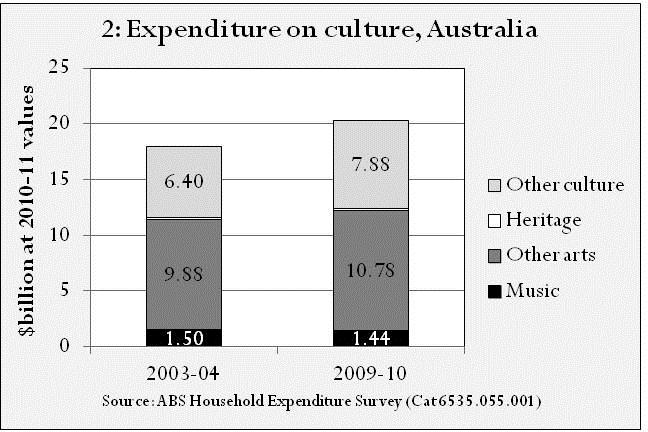
The big winner in the culture expenditure stakes over these six years was other culture, which is basically culture-related hardware. It increased its share of total expenditure on culture from 35.6% to 38.8%, with expenditure growing at 23.1% over the period. Television almost doubled its share within the group (to nearly $3.5 billion); the only other category to gain was audio equipment. Video equipment, photographic equipment and (especially) home entertainment systems lost out.
The other big category, other arts, grew by a less vigorous 9.1%. While losing some share of total culture (from 55% to 53%), it remained the largest group. The winner within the group was broadcasting, electronic media and film (+23.1% to a $4.8 billion position unrivalled by any other cultural category). In the process it surpassed literature which showed a marginal fall but sustained expenditure around $4.1 billion. Live theatre showed a marginal gain (to $457 million), visual arts and crafts a thumping 39% loss to $500 million, and culture courses, fees and charges the highest percentage growth in the group (55.5%) to $910 million.
Heritage is a relatively small cultural expenditure component, declining 3.4% to $188 million (barely visible on Chart 2). National parks and zoos gained 7% and art galleries and museums showed a 20% drop to from $75 to $60 million.
The music group, finally, showed the most dramatic internal change. While total expenditure declined by 3.4% to $1.44 billion, expenditure on CDs and audio records dropped by almost half to $406 million and musical instruments and accessories showed a 40% drop to $201 million. The big winner in the group was music concert fees and charges, growing by 133% from $356 million in 2003-04 to $833 million in 2009-10.
In short, it is not just the music sector that is undergoing dramatic change as part of Australian cultural expenditure. The statistics are as reliable as our highly reputable central statistical organisation can make them (always showing the statistical measure of relative standard error to illustrate uncertainties in survey findings).
Part of the development is associated with the ongoing digitization of our lives. It is hardly a coincidence that the category of ‘other arts’ containing electronic equipment, broadcasting and film grew by 23% over the six years to 2009-10, the same as the total of the fastest growing main group, ‘other culture’. The expenditure survey, however, is not specific enough to capture the full detail, partly because the categorization of goods and services is kept in conventional form to ascertain trends from survey to survey.
We did look for the growth in internet charges which increased 7½ times in constant 2010-11 values, from $440 million in the 2003-04 household expenditure survey to $3.3 billion in 2009-10. It is evidently important but other factors must have been at play as well to cause the violent changes that have occurred across the range of cultural expenditure categories.
Australia’s musical trade balance remains in the red
Music products are traded as physical exports and imports (largely musical instruments). In common with all other cultural goods the physical trade balance is universally negative: in 2009-10, total imports of such goods amounted to $2.4 billion and total exports to $540 million (22% of imports). For musical instruments (including other performing arts equipment) imports totalled 6% of total cultural goods imports ($146 million), while the comparable ratio of exports was a mere 2% (exports totalling $10 million).
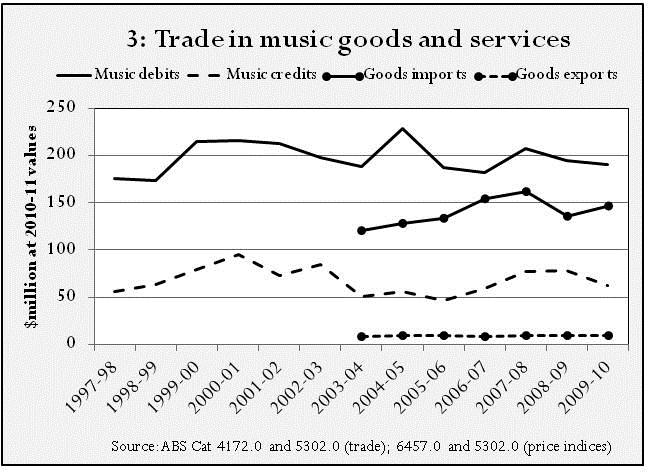
The second line on Chart 3 shows that imports of musical goods may have risen slightly between 2003-04 and 2009-10; previous statistics are still to be added to the knowledge base. Exports, however, have remained largely static around $9-10 million at constant 2010-11 values, averaging only 7% of the import value.
The second part of overseas trade in musical goods is in services, which are largely music royalties. Debits (equivalent to imports in so far as they reduce the trade balance) have remained largely stable in constant value terms, at around $200 million per annum. Credits (adding to the trade balance) have also remained largely static, though they seem to have gone through a cycle, representing an average of 37% of debits (imports) during the first five years to 2001-02, then declining to 30% during the next four years (to 2005-06) before recovering to 36% during the latest four-yearly period. Generally, however, the picture looks flat over the twelve years shown on Chart 3.
The export-import situation for musical goods and services remains a concern, with no real recovery emerging from the statistics.
Conclusion
The knowledge base aims to provide a balanced picture of the Australian music sector expressed in statistical and verbal descriptions, and discussions of issues arising from these descriptions. Music Forum readers are cordially invited to add to these descriptions and issues – indeed we need this support.
One obvious purpose of strengthening the statistical base of the music sector is to identify weaknesses as well as strengths – warning signals in other words. That’s why the Music Council keeps advocating for better data. The choice of our three examples in this article was not made deliberately to sound a warning, but all three raise issues relating to the structure of the core music sector. Neither are many other possible examples more encouraging, such as the declining number of music professionals (and other arts professionals) which was revealed for the first time by the 2006 Census. We must anxiously await the results of the 2011 Census to see whether these late trends were continued or reversed.